sentinel-kit
📊 Monitoring & Health
This guide covers comprehensive monitoring of Sentinel Kit components, performance optimization, and health management.
Overview
Sentinel Kit provides multi-layered monitoring through integrated tools and dashboards:
- Real-time Service Health: Component status and availability
- Performance Metrics: Resource usage and processing rates
- Log Ingestion Monitoring: Data flow and processing health
- Security Operations Metrics: Alert generation and response times
- Infrastructure Monitoring: System resources and capacity
Stack Health Monitoring
Service Status Panel
The main dashboard provides real-time service health:
Component Status Indicators:
- 🟢 Healthy: Service running normally
- 🟡 Warning: Performance degraded or approaching limits
- 🔴 Critical: Service unavailable or failing
- ⚫ Unknown: Unable to determine status
Monitored Services:
- Frontend (Vue.js application)
- Backend API (Symfony application)
- Elasticsearch (search and storage)
- MySQL (configuration database)
- FluentBit (log collection)
- Caddy (reverse proxy)
- Grafana (metrics visualization)
To check service health, just use console app:
./launcher status
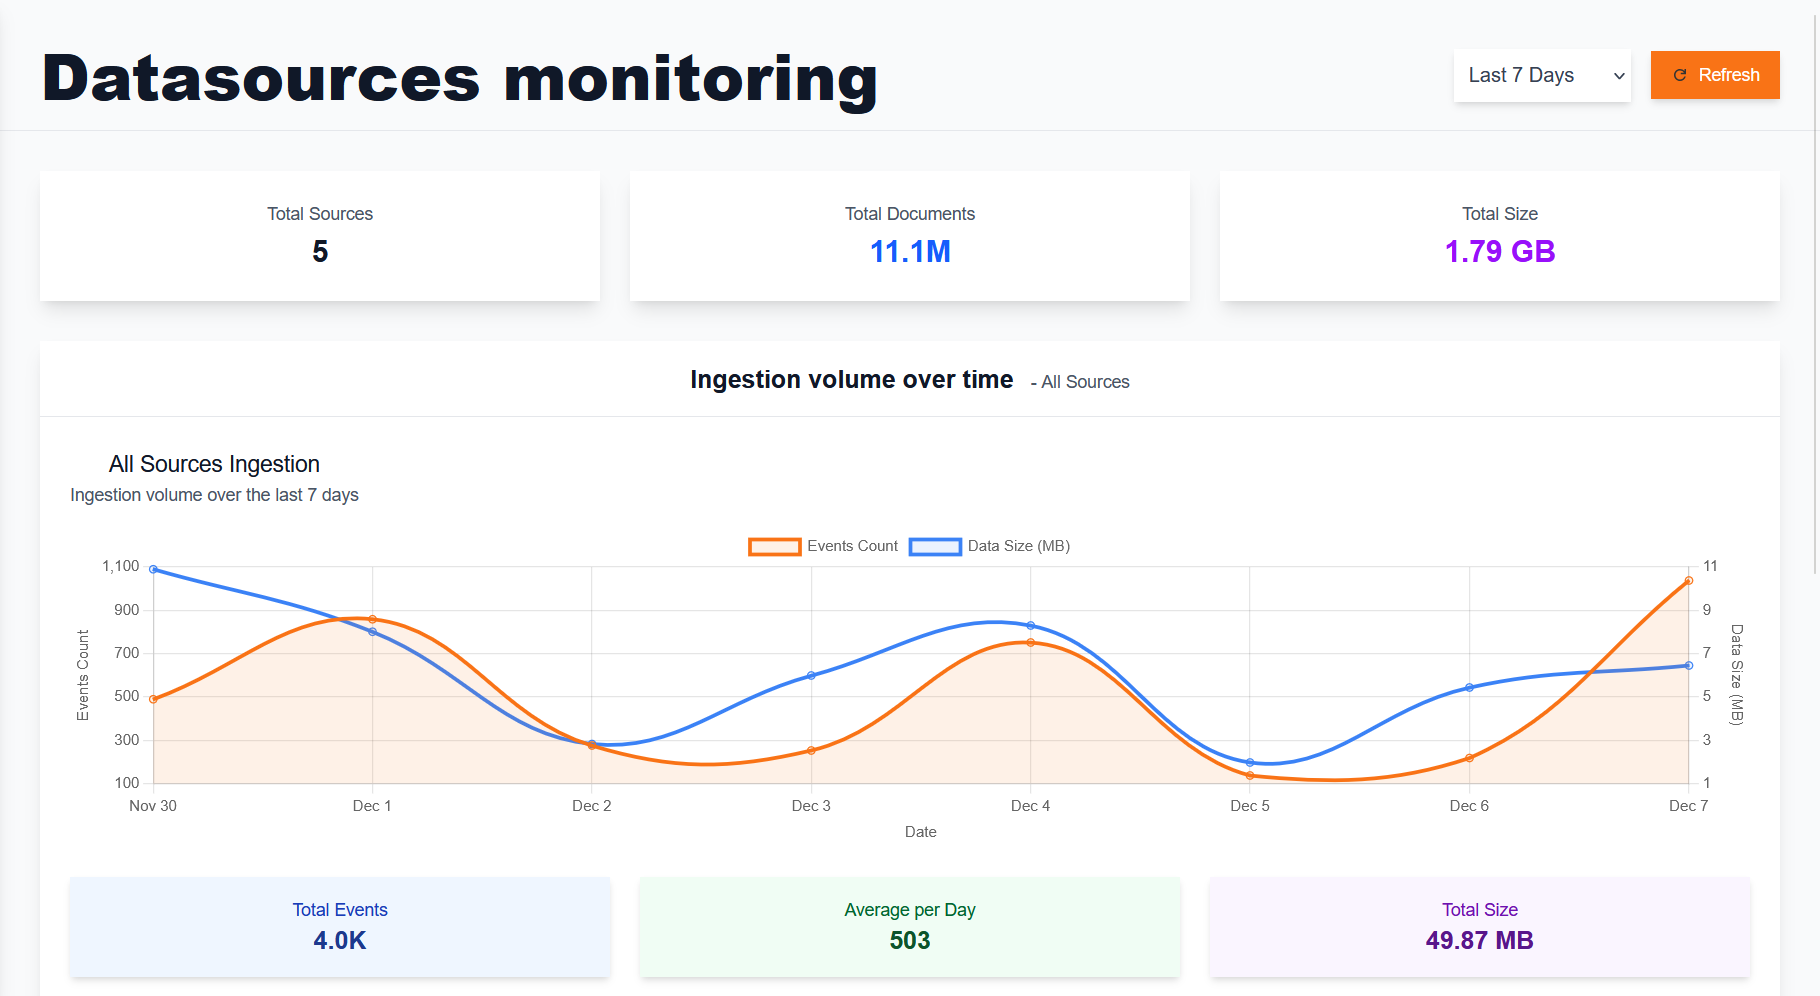
Logs ingestion monitoring
Go to Sentinel-Kit datasources menu (https://sentinel-kit.local/datasources by default)
Services Performance Metrics
Sentinel Kit includes a set of monitoring services that are enabled when the internal-monitoring profile is added to your COMPOSE_PROFILES in the .env file. These services rely on Prometheus, which is queried by Grafana.
Key Performance Indicators:
- Alert Processing Time: Time from log ingestion to alert generation
- Dashboard Response Time: Web interface responsiveness
- Search Query Performance: Elasticsearch query execution time
- Log Ingestion Rate: Events processed per second
- Storage Usage: Disk space utilization trends
By default, Grafana is accessible at:
https://grafana.sentinel-kit.local
Access Credentials
The access credentials for Grafana can be customized in the .env file:
GF_SECURITY_ADMIN_USER=sentinel-kit_grafana_admin
GF_SECURITY_ADMIN_PASSWORD=sentinel-kit_grafana_password
Initial Setup
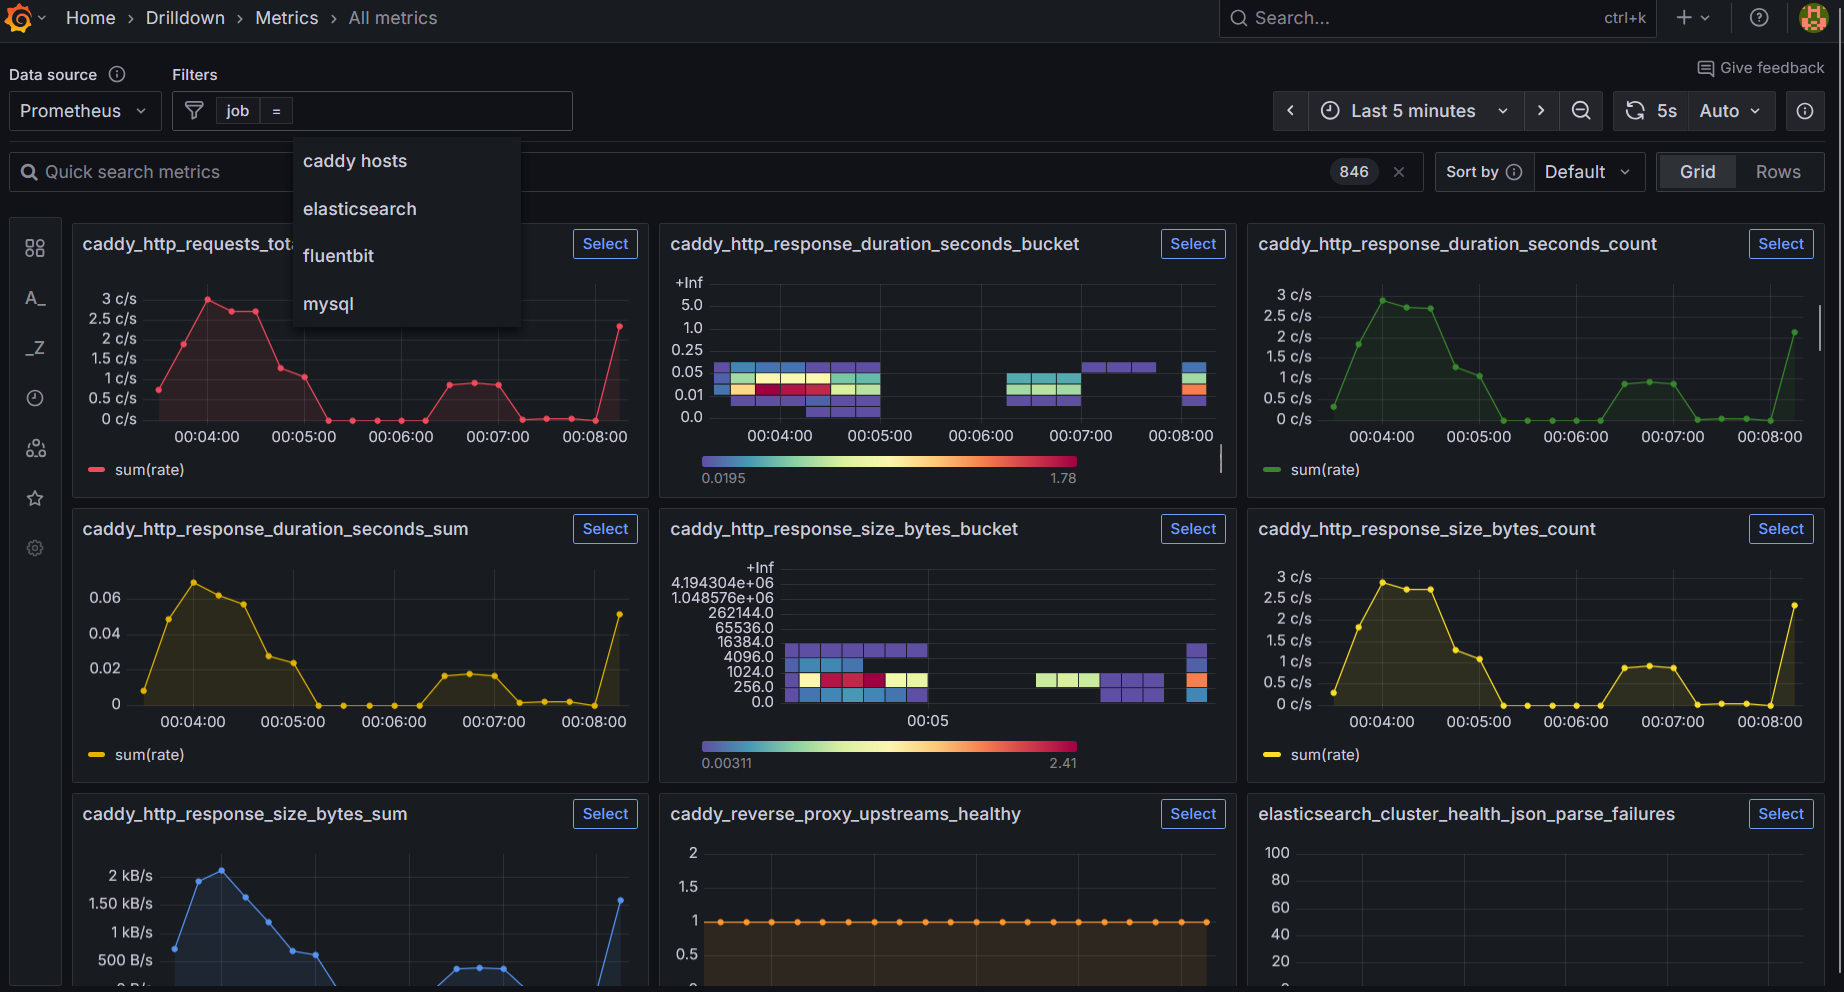
In its default configuration, Sentinel-Kit does not include any custom dashboards. However, the services for fluentbit, mysql, and elasticsearch are already configured within the platform. You can access all available metrics under the metrics section, and it is also possible to filter by service (jobs).
Importing Additional Dashboards
You can import many additional dashboards from the official Grafana website.
- Grafana → “+” → “Dashboard”
- Add Panel → Select visualization type
- Configure data source (Prometheus)
- Build queries and configure display
Performance Consideration
Warning: On systems with limited memory or CPU resources, it is recommended to avoid enabling the internal-monitoring profile to ensure optimal performance.
«Back to index